Intel recently released the new NM10 chipset which enables the newest Atom CPU’s, the dual core + dual hyperthread N550, which support 64 bit Windows.
I already own an LG x110 with a very nice Atom 270 (roughly the same performance as the Atom 450) and I wanted to know the performance improvements between the old and the new netbooks. Sooo, I downloaded www.passmark.com ‘s free and easy benchmark software and this is what I found:
- An overall improvement of about 35% from the old Netbook to the new Netbook
- From my brief usage of the new Atom N550 bases Samsung NF210, this feels like the right number.
- The Intel Atom N550 can do alot more than the older Atom N270 / 450
- The NM10 integrated video is notably faster than the older Atom 945 Integrated Video
- Because I already own licences of Win 7 64 Bit, the change from 32 bit was worth the effort
- The new netbook (Samsung NF210) shipped with Windows 7 Starter and that worked shockingly well but it is only 32 bit and given my extra licences, it just did not make sense to stay with it.
- For most people Windows 7 Starter is just fine on a Netbook
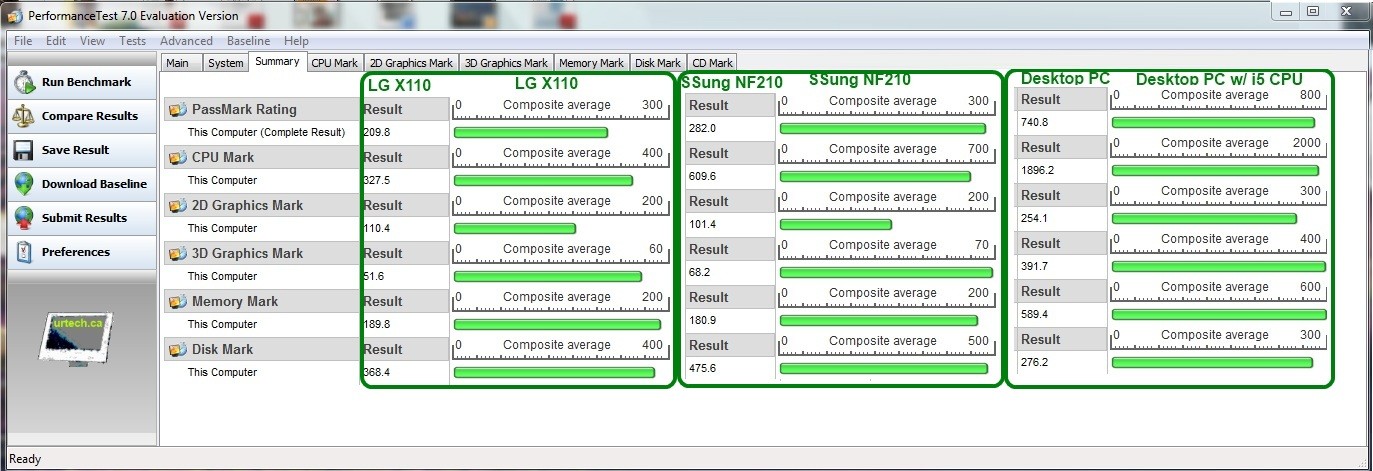
All of these benchmarks were run on fairly recent Windows 7 Ultimate installs (with all current patches and BIOS’s installed) with Microsoft Security Essentials still running because I wanted real world results. This is not supposed to be a super clean benchmark test, just a test to provide real world results. I also ran the PassMark benchmark on my current desktop PC which uses nothing fancy (not even a discrete video card) so this will provide a nice comparison to average real world (non-gamer) current desktops:
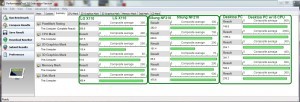
- Old LG x110 vs New Samsung NF210 vs Standard Desktop PC with i5 CPU Comparison Benchmarks
|
Hardware Type |
Old Netbook LG x110 |
New Netbook Samsung NF210 | New Netbook Samsung NF210 | Desktop PC Gigabyte H55UD2H |
| CPU | Atom 270 1.6Ghz 1+1 Cores | Atom N550 1.5Ghz 2+2 Cores | Atom N550 1.5Ghz 2+2 Cores | Intel i5-650 3.2Ghz 2+2 Cores |
| Hard Drive | Western Digital 160GB WD1600BEVT | Hitachi 250GB HTS543225A7A384 | Hitachi 250GB HTS543225A7A384 | Seagate 1.5TB ST31500341AS |
| Video Card | Intel Integrated GMA 950 | Intel Integrated Graphics Media Accelerator 3150 |
Intel Integrated Graphics Media Accelerator 3150 |
Intel Integrated HD Graphics on 945 Express Chipset |
| Windows | Win7 Ultimate 32 Bit | Win7 Ultimate 64 Bit | Win7 Ultimate 64 Bit | Win7 Ultimate 64 Bit |
| TEST | 32 Bit PassMark | 32 Bit PassMark | 64 Bit PassMark | 64 Bit PassMark |
| PassMark Overall Rating | 209.8 | 282 | 296.1 | 740.8 |
| CPU – Integer Math | 20.9 | 41.9 | 120.9 | 673.1 |
| CPU – Floating Point Math | 91.7 | 181.4 | 237.3 | 845.3 |
| CPU – Find Prime Numbers | 63 | 95.4 | 76.6 | 471.8 |
| CPU – SSE | 1.5 | 2.6 | 1.8 | 4.7 |
| CPU – Compression | 676.3 | 1352.4 | 1421.5 | 1940.8 |
| CPU – Encryption | 2.5 | 5 | 5.3 | 7.1 |
| CPU – Physics | 16.5 | 31.1 | 37.4 | 125.5 |
| CPU – String Sorting | 390.5 | 799.3 | 735 | 1496.6 |
| Graphics 2D – Solid Vectors | 0.6 | 0.7 | 0.8 | 1.3 |
| Graphics 2D – Transparent Vectors | 0.6 | 0.8 | 0.8 | 1.3 |
| Graphics 2D – Complex Vectors | 87 | 21.7 | 20 | 84.9 |
| Graphics 2D – Fonts & Text | 22.7 | 26.6 | 29 | 130.5 |
| Graphics 2D – Windows Interface | 14 | 14.9 | 16.2 | 64.2 |
| Graphics 2D – Image Filters | 73.7 | 79.4 | 40.6 | 167.1 |
| 2D Graphics – Image Rendering | 74.3 | 97.2 | 99 | 271.6 |
| Graphics 3D – Simple | 90.7 | 141.7 | 139.7 | 603.6 |
| Graphics 3D – Medium | 16.2 | 15.4 | 16.9 | 145.5 |
| Graphics 3D – Complex | 2.3 | 2.3 | 2.4 | 20.8 |
| Memory – Allocate Small Block | 728.2 | 639.6 | 987.5 | 2702.3 |
| Memory – Read Cached | 692.2 | 669.8 | 752.7 | 1251 |
| Memory – Read Uncached | 624 | 582.2 | 637.7 | 1237.1 |
| Memory – Write | 607.1 | 626.3 | 659.1 | 777.1 |
| Memory – Large RAM | 83.1 | 75.2 | 114.8 | 939.9 |
| Disk – Sequential Read | 43.9 | 71.8 | 69.4 | 51.4 |
| Disk – Sequential Write | 55.2 | 57.1 | 47.9 | 20.9 |
| Disk – Random Seek + RW | 2.8 | 2.6 | 2.2 | 4.1 |
| CPU Mark | 327.5 | 609.6 | 632.6 | 1896.2 |
| 2D Graphics Mark | 110.4 | 101.4 | 102.8 | 254.1 |
| Memory Mark | 189.8 | 180.9 | 218.6 | 589.4 |
| Disk Mark | 368.4 | 475.6 | 432.2 | 276.2 |
| 3D Graphics Mark | 51.6 | 68.2 | 69.1 | 391.7 |


0 Comments