What is Technical Analysis?
Technical Analysis is the science of predicting where individual stocks and markets as a whole will move in the future.
As a home based trader Technical Analysis is really the only way you can “beat the street”. You are just not going to know as much about the internal workings and future prospects of a company, as a full time corporate analyst will.
The math behind Technical Analysis is done by brilliant minds coming out of STEM focused universities and colleges requiring much expert services on assignments e.g. CWAssignments.com.
Technical Analysis Is What Finds Business Cycles
When I was in university I recall arguing with my finance professors about how so called business cycles CAUSED the market to move. Business cycles are just repeating paterns through history that say things like when the market turns up (aka becomes a Bull) you can safely bet on it going up 30% or more. For instance, in April of 2021 CNBC noted:
On average, the history of the S&P 500 shows that the first-year return of a bull market is 38% and the second year less than 12%. …The 6% compound annual growth rate that the S&P 500 has turned in on a rolling 10-year basis going back 100 years. The implication is things will be coming down. An ease of gains rather than erase of returns. SOURCE
Business cycles and technical analysis go hand in hand. Instead of looking at the fundamentals of a company or market, both business cycle analysis and technical analysis consider historic trends to predict the future. They assume that there is little need to look at the details of a company to determine its trajectory because the stock price has already baked in all known information.
It turns out that as frustrating as it sounds, my professors were correct; company value can be accurately predicted using little more than known metrics and common sense.
Technical Analysis for Dummies Quick Start Guide:
Software is your best friend when it comes to TA but you need to understand what that software is doing so here are some of the concepts you need to grasp.
1: The Trend is Your Friend
If the market is moving up or a stock is moving up, it will typically continue to do so. The contrary is also true and stock brokers like to phrase this as ‘don’t catch a falling knife’. This is why I bought a small amount of Tesla stock last year. I do not believe that Tesla fundamentals justify the stock price, but in the end, I don’t care as long as others believe it does which causes the stock to increase in value.
2: Things Average Out Over Time
In Technical speak this is called Mean Reversion, which means (pun intended) that after a quick run up the stock or overall market will return roughly to its long term average.
3: Candles Light The Way
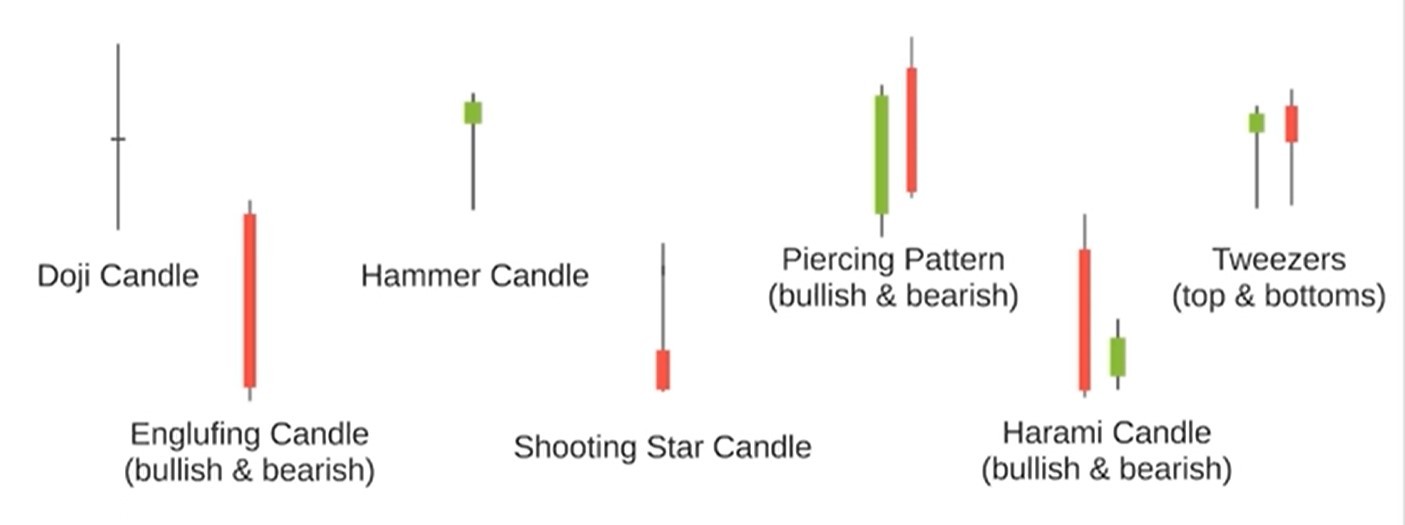
You can look up each one of these but the idea is to compare the demand for a stock with the supply. In other words comparing how many shares are for sale (and their price), to how many shares people are trying to buy (and their price), is a valid way to estimate tomorrows fair market value. It is a very good sign when current owners of a stock are not willing to sell their shares at the current price and Technical Analysts take that to mean the price is going to change. In the end supply always equals demand.
4: Always Use Your Indicators
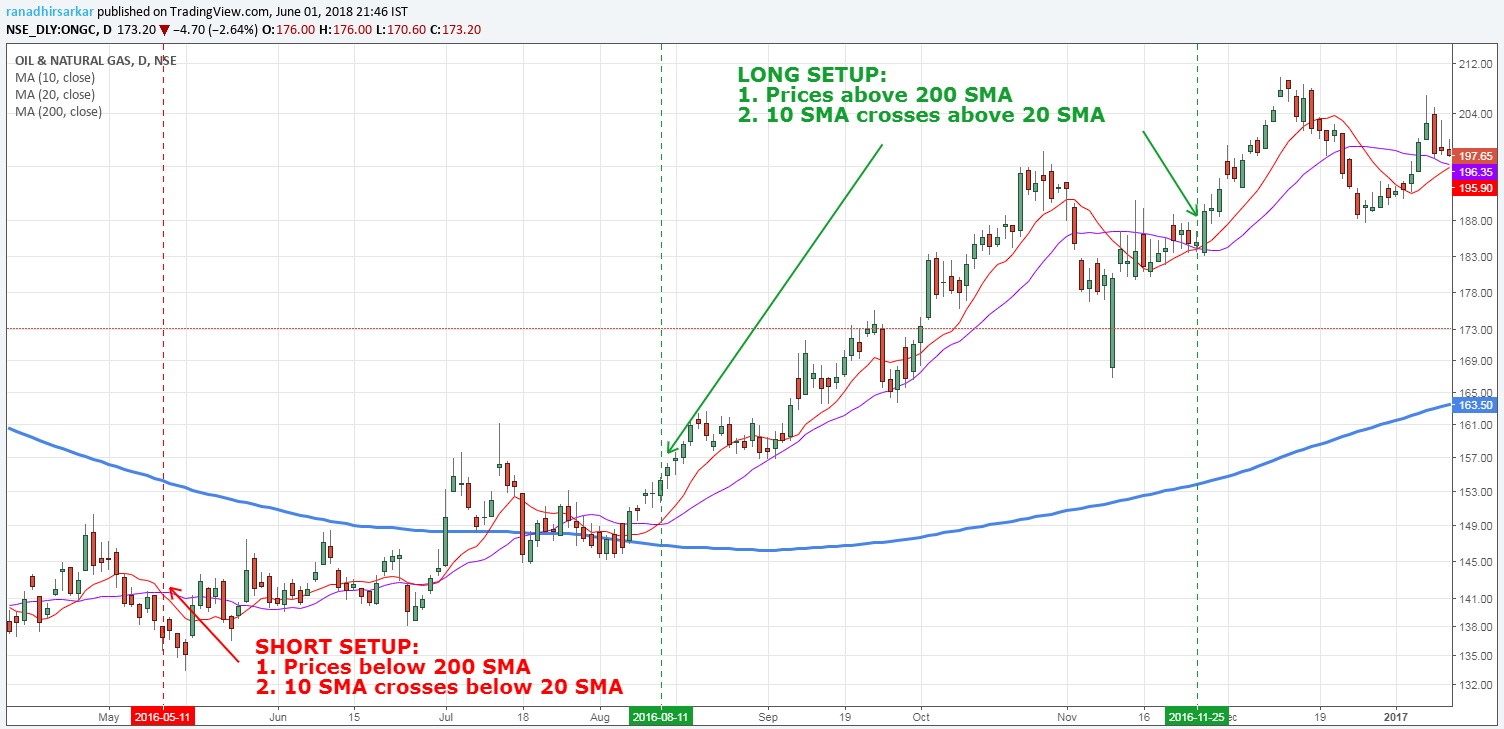
The most common “indicator” in Technical Analysis is the “200 day moving average” which is a line (hopefully an upward curve) shows the price of the previous 200 days average. Shown above is the Single Wing Trading Strategy which you should be selling this stock until about mid-August. That is because the 200 day moving average prior to August 13th is declining. After the middle of August the 200 day moving average is swinging upward, indicating it is safe to buy.
5: Chart Patterns Are Pretty
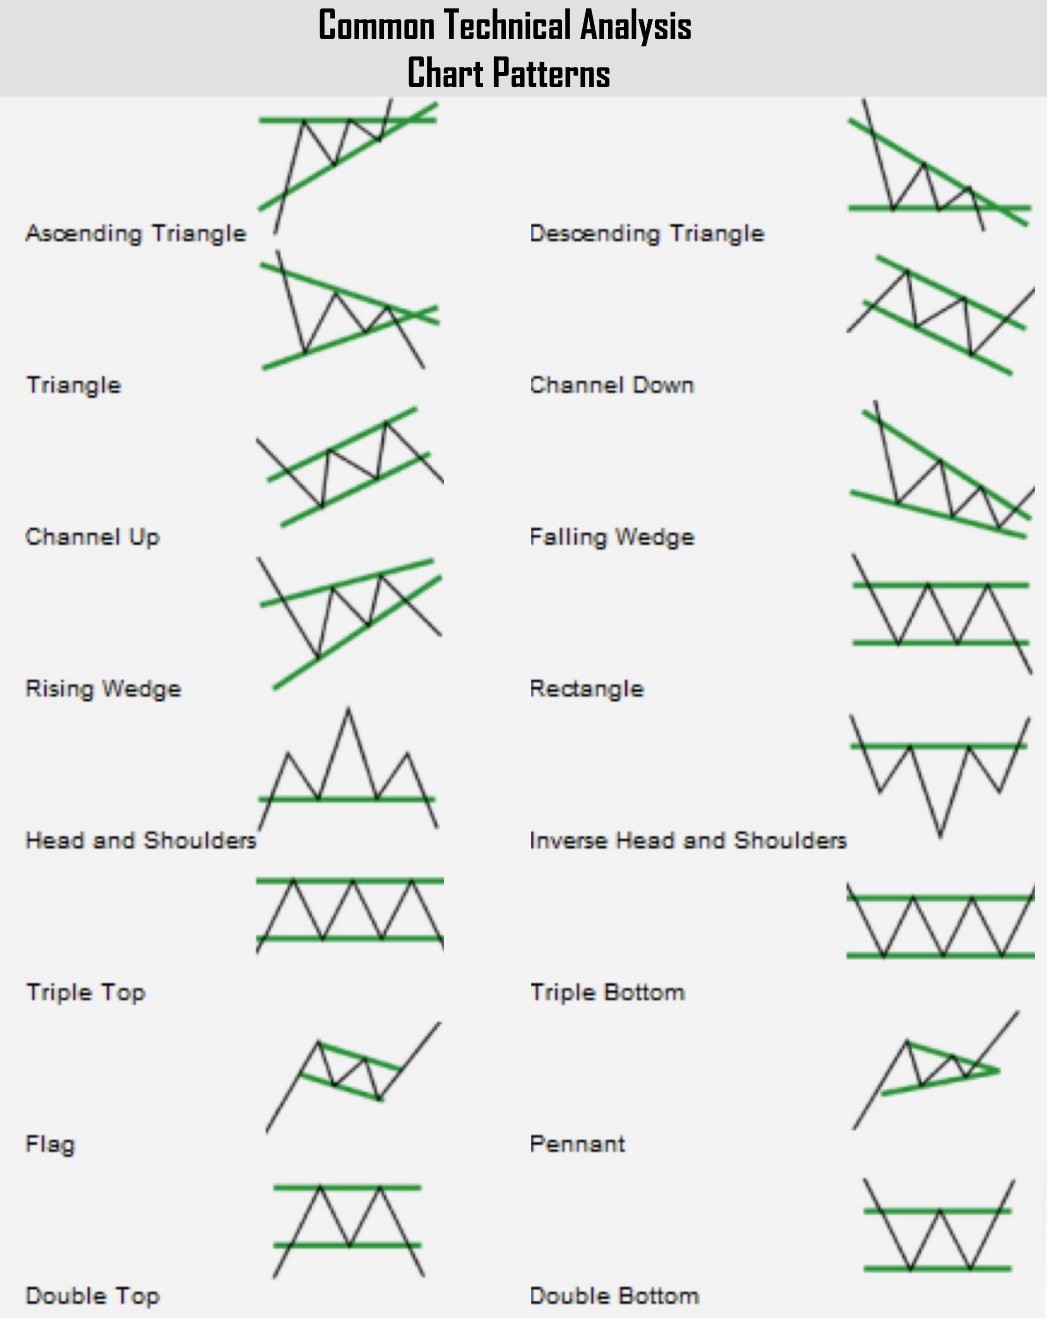
If you chart stock prices overtime you can draw lines that show things like “points of resistance” in which you can see that the stock just can’t get over (or under) a specific price. Technical Analysts believe this is because those who know the inner workings of the company have figured out that there is a fundamental value above or below which, they will not participate. This can tell you when a trend is likely to “expire” and reverse.
6: Support the Resistance
This is another derivation of trend analysis. Unless you are aware of a fundamental change, like the entire stock market is crashing, or the company is likely to be acquired for a higher value, “support” occurs when a stock price below the average and “resistance” occurs when the stock is above the average. Once a stock price has broken through the previous ceiling or “point of resistance” it then becomes a floor below which buyers of the stock will “support” it with more purchases.
Easy Technical Analysis?
Following any one of the six strategies outlined are unlikely to result in serious long term profits. So getting good at any one of these is not particularly valuable. The key to success and profits with Technical Analysis is to employ many of these strategies at the same time. Once each of these calculations are done, you can combine the results using a single buy hold or sell decision making algorithm.
If that sounds like a lot of work, you are right. Staying up to the minute on your technical analysis today is only possible with the help of computer programs. Some of these can be downloaded and run on your computer directly but more and more they are web based SaaS.
Science Technology Engineering and Math (aka STEM) education has been in sharp focus in recent years. Some of these kids need help with technical assignments. However, we still don’t have enough STEM students graduating so the competition for those big brains drives their wages up and in turn, drives up the cost of Technical Analysis software like VectorVest and SeakingAlpha.
How do they do it? Volume volume volume! For example, If the developers have to pay their best engineers 20% more, they don’t have to raise their software prices if they can sell 30% more product. Technical Analysis software is increasingly popular and that keeps its prices reasonable.


1 Comment
Simplifying Stock Trading and Top Canadian Picks – Up & Running Technologies, Tech How To's · December 29, 2023 at 10:47 am
[…] (P/E) ratio can help determine if a stock is undervalued or overvalued. Finally, consider technical analysis to identify optimal entry and exit points based on price trends and key technical […]