What are the top tools available? More important, why are they the best? Is it all about price, size or age of the vendor’s organization, or is it something else? The accepted definition of log aggregation, “Gathering log files from diverse sources and arranging the data so that it’s easily searchable,” offers a partial answer to that question. By far, three of the most popular choices are Graylog, Papertrail and ELK.
Here’s a summary of each option:
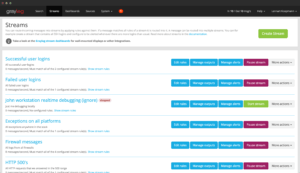
 Papertrail

This top of the line product from SolarWinds is a versatile log aggregation tool for DevOps teams who want real-time aggregated data in order to facilitate debugging, trouble-shooting and comprehensive diagnosis. This cloud-based tool is lightning fast, especially for app and infrastructure challenges that call for quick trouble-shooting attention. Not only does Papertrail allow for complete log consolidation, you can also diagnose and make fixes because activity is displayed in real time.
Top performance and very reasonable pricing are what draw the attention of so many Papertrail users. There’s really no significant downside to Papertrail unless you already have a log management tool that you refuse to give up or change from.
 Graylog

Graylog has built a reputation for being one of the most efficient management systems due to its variety of tools for different kinds of data analysis no matter what server sends. Many users say that ELK and Graylog are just two slightly differing versions of the same product, but that criticism misses the point. In fact, in order to be sure, the Graylog stack is working properly, make sure Elasticsearch and MongoDB are part of your system configuration. Graylog needs them both to function at 100 percent capacity.
Graylog’s GUI is friendly and the system has the capability to accept a lot of different data sources and formats. You can easily exercise complete control over user permissions and authentication. Another nice feature: Graylog can accept email alerts if you configure it properly. On the downside, Graylog is not able to read any syslog files, which means you’re forced to transmit any messages directly to Graylog. The dashboard could use some rearranging to make it more user-friendly, and there are some problems with robustness of reporting.
 ELK
ELK
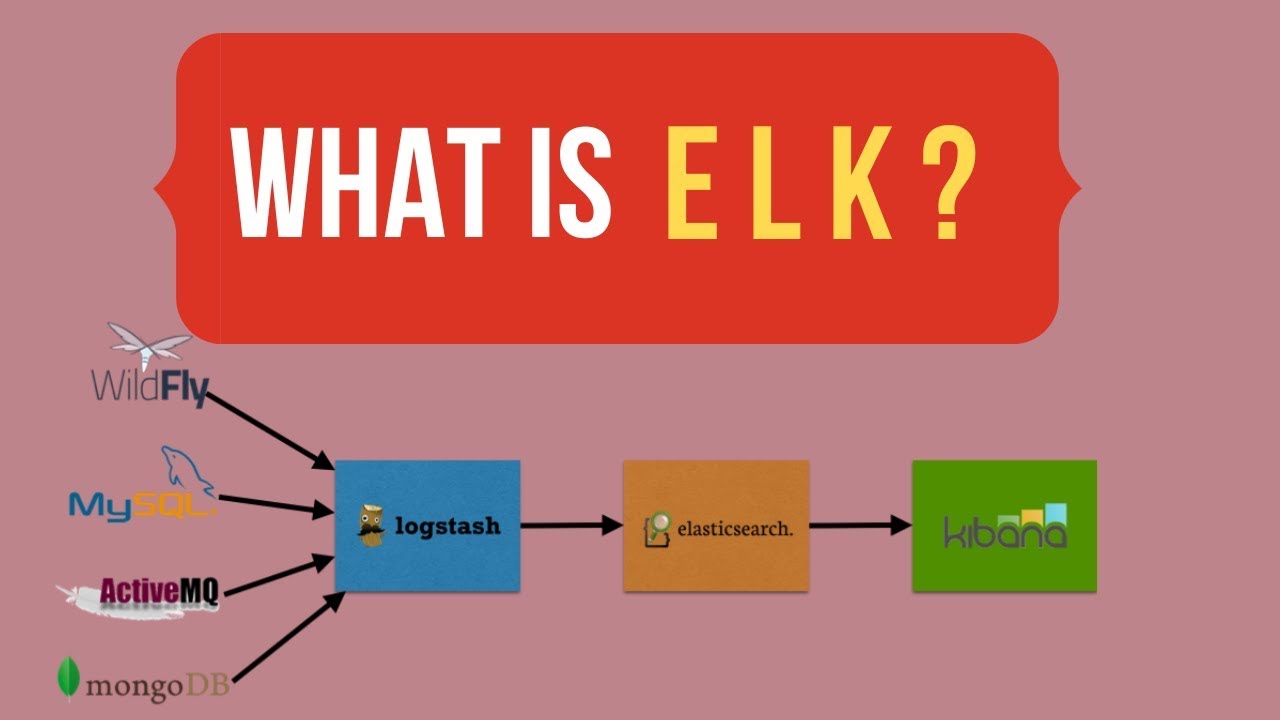
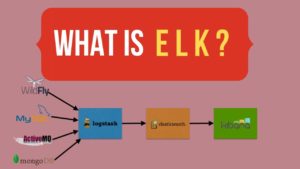
ELK is three products in one, hence the initials: Elasticsearch, Logstash and Kibana. The first is not related to log management but the other two are. ELK delivers to designated servers. ELK has grown in popularity recently due to its comprehensive functionality and ease of use.
If you want to integrate your ELK tools with Elastic products you already use, the chore is a simple one. Installation is a snap and the documentation are first-rate. ELK is one of those technical products that has its own cheering section and devoted long-term following. On the negative side, ELK also has a reputation for being something of a resource hog. In fairness, the product has improved a lot in the last couple of years but still lags when matched up against some of its main competitors.


0 Comments